FlexDoc/XML - DiagramKit - FAQ

- DiagramKit Settings
- Component Properties
- Generator Setups
Diagram Settings
How to customize generated diagrams?
Run FlexDoc/XML+DiagramKit to invoke the Template Processor (Generator) (e.g. by runninggenerator.bat).
You will see the Generator Dialog:

In the Parameter Inspector dialog that will show up, you will see a large tree of various parameters. Go to the bottom of that tree and open «DiagramKit» parameter group, which is shown in the fully expanded form on the following screenshot. These are currenly all settings that control DiagramKit (i.e. the generation of diagrams):
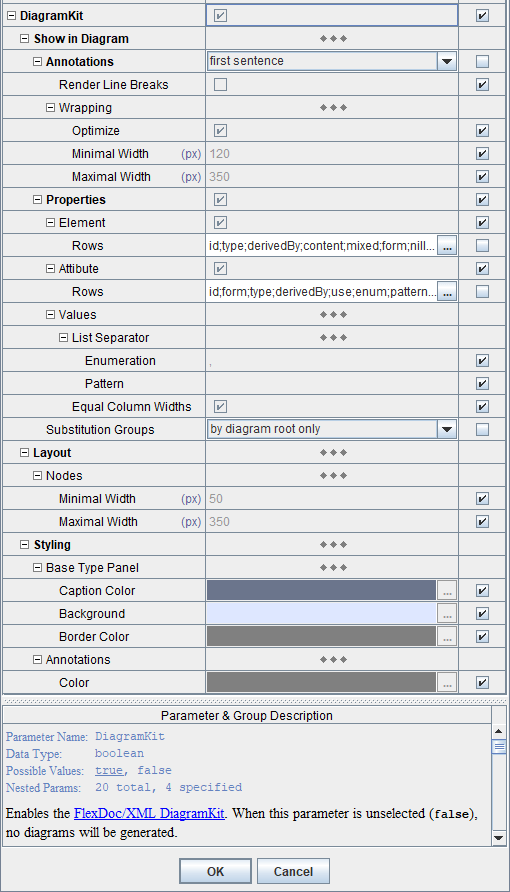
«DiagramKit» parameter group is present in all main templates of both XSDDoc and WSDLDoc. However, it is enabled only when the DiagramKit Plugin is active.
See Also:- FlexDoc/XML | XSDDoc | FAQ | Generator Settings | What are Template Parameters?
- FlexDoc/XML | XSDDoc | Templates | Main Templates
- FlexDoc/XML | WSDLDoc | Templates | Main Templates
How to show/hide annotations?
The generation of component descriptions visible on diagrams is controlled by the parameter: as well as the parameter sub-tree below it (which together are called parameter group).Using that parameter, you can specify whether to show in the diagrams:
- Full descriptions of the components
- Only first sentences of the diecriptions
- None at all
<xs:annotation> elements found in the XML schema in the definitions of components.
Wrapping of annotation
The annotation text may be of any length. However, it can occupy only limited width on the diagram that forms a column into which the entire text is wrapped. That wrapping is the subject of a compromise:- The narrower the text column, the higher it is (to fit all the text), which will increase overall hight of the diagram. Too narrow text columns are also more difficult to read.
- On the other hand, wide text columns will stretch the whole diagram horizontally, which must be limited too.
-
DiagramKit | Show in Diagram | Annotations | Wrapping | Minimal Width
Specify the guaranteed minimal width (in pixels) of the rectangle, in which the annotation text is wrapped. You can see the effect of this parameter on the following screenshots.
This diagram has been generated with the annotation minimal wrapping width set to 100 px:

The same diagram generated with the annotation minimal wrapping width set to 300 px:

-
DiagramKit | Show in Diagram | Annotations | Wrapping | Optimize
Specify whether the annotation text will be wrapped so as to maximally utilize the empty space arisen in the diagram because of its layout.
The effect of this parameter can be seen on the following screenshots. On the left is a fragment of the diagram generated with the annotation wrapping optimization disabled. On the right is the same diagram generated with the wrapping optimization enabled. Click on each sreenshot to see the full diagram:


How to show/hide element/attribute properties?
Displaying of element/attribute properties is controlled the parameter group «DiagramKit | Show in Diagram | Properties».For further details, please see: FlexDoc/XML | DiagramKit | FAQ | Component Properties
How to show/hide substitution groups?
Substitution groups are shown in diagrams:- As chains of member elements, which is controlled by the parameter «DiagramKit | Show in Diagram | Substitution Groups»
-
With
substGrpandsubstWithelement properties
As member chains
Any substitution group can be shown on diagrams as a chain of diagram nodes depicting all substitution group members (or hierarchy of them) attached to the substitution group's head element.
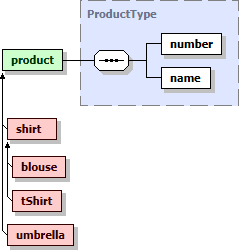
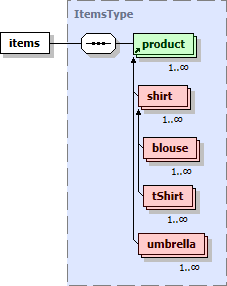
On the following two diagrams, you can see the same substitution group with its members highlighted in red and its head element 'product' highlighted in green.
On the left diagram, 'product' is the diagram's root node (i.e. the diagram depicts its content model).
On the right diagram, 'product' is an ordinary node, just one among others:
 |
 |
That substitution group is actually multilevel one. The elements 'blouse' and 'tShirt' are members of own substitution group headed
by 'shirt' element, which itself is a member of 'product' substitution group.
-
- always
- Show the member chain by every depiction of substitution group's head element (as shown above)
- by diagram root only
-
Show the member chain only when the substitution group's head element is the diagram's root node (as on the left diagram above).
Such a requirement may arise when there are too many substitution groups and/or they are too large, so showing them by every depiction of a corresponding root element will bloat the diagram to unmanageable size. As an example see “XML schema for MathML 3.0”, which extensively uses multilevel substitution groups.
- none
- Do not show the member chains
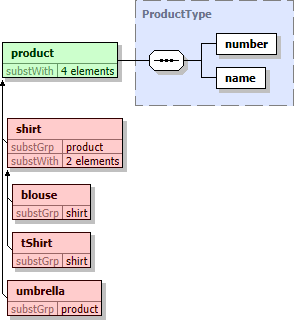
With element properties
Besides the member chains, another way to display substitution groups on diagrams is using these two element properties:-
substGrp– applicable to substitution group members, it shows the name of the substitution group head -
substWith– applicable to substitution group heads, shows the number of elements this element can be substituted with (basically, the numbers of substitution group members)
 |
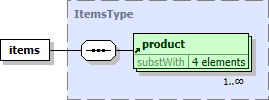 |
'products' is a substitution group head can be recognized by its substWith
property.
How to stretch/shrink things shown on diagram?
About diagram nodes
Diagrams generated by DiagramKit are built of rectangular objects called nodes, which represent- Either a single XSD component (e.g. element, attribute, group etc.)
- Or a collection of components of a certain type (e.g. attributes)
The relations between XSD components are depicted on the diagram in two ways:
- By connecting the corresponding diagram nodes with lines
- By enclosing some diagram nodes into others
For example, on the following diagram, all 7 simple nodes are highlighted in red and other 3 nodes are complex ones:

Controlling node widths
The width of a complex node is determined entirely by its content (i.e. the widths and layout of the nodes contained in it). That is calculated automatically and cannot be influenced from outside.
Some complex nodes may include a description of the XSD component represented by the entire node (e.g. <xs:complexType>).
Such a description is shown at the top of the node rectangle and will be wrapped inside it.
As the minimal wrapping width of any descriptions is controlled by the parameter:
«DiagramKit | Show in Diagram | Annotations | Wrapping | Minimal Width»,
that may also influence the width of the node.
- First, the node's preferred width is determined according to its content (e.g. the name of the XSD component it represents).
-
When the preferred width is smaller than the minimal one specified with
«Nodes | Minimal Width»
parameter, the node's border is extended horizontally up to the required minimum.
The effect can be seen on the following screenshots of the same XSD component (an element group with a very short name). On the left, the minimal node width was 10 px. On the right, it was 50 px (default).


-
When the preferred width is larger than the maximal one specified with
«Nodes | Maximal Width»
parameter, some content of the node will be clipped so as to fit it into the maximal allowed width
(and the ellipsis added to the displayed text to indicate the clipping).
The effect can be seen on the following screenshots of the same XSD element component. On the left, the maximal node width was 350 px (default). On the right, it was 200 px.


-
An exception to that rule make the nodes representing XML schema compositors
(e.g.
<xs:sequence>,<xs:choice>and<xs:all>), which are always depicted with special icons. -
The maximal width specified with «Nodes | Maximal Width»
parameter is particularly important for displaying component properties, because values of some properties (e.g. enums) may easily stretch to any width.
By setting that parameter, you can adjust the displayed part of property values as wide as you need.
For more details about component properties, please see: FlexDoc/XML | DiagramKit | FAQ | Component Properties
Node height
The height of a diagram node (both simple and complex) is not limited anyhow and will be determined by the particular node type and its content.How to make diagrams look the same as in XMLSpy?
Some people ask, how to make the diagrams generated by DiagramKit to have the same color schema as the XSD diagrams in XMLSpy.For instance, how to change the light blue background of the component diagrams to the familiar (to the clients) light yellow of XMLSpy?
Here is how to do that:Go to the parameter group «DiagramKit | Styling» and specify the color parameters inside that group as follows:
-
Base Type Panel | Caption Color = 808080Base Type Panel | Background = FFFFC0Base Type Panel | Border Color = 808080Annotations | Color = 808080
- Uncheck the default checkbox
- Click over the colored rectangle to activate the code text editor